This year’s compensation report continues to reflect the total lack of standardization in the specialty, further proving the supply-demand status of the market. Jobs in highly desirable lifestyle areas feature significantly lower incomes because those employers don’t need to use dollars as a draw. The following numbers are based on 1,632 clinical hours per year and include incentive bonuses and RVUs where applicable. The annual incomes include a basic benefits package worth $25K. Sign-on bonuses, loan assistance, and other perks are not included. Rankings are based on state averages, not the sporadic highs.
Explore This Issue
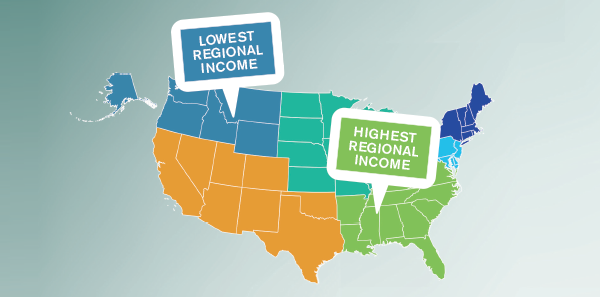
ACEP Now: Vol 34 – No 10 – October 2015 The Southeast leads the country in compensation, with all state income averages near or topping $200 per hour. Louisiana is back in the top 10 for the first time since Hurricane Katrina!
ALABAMA: Average of $196 per hr./$344K annually, high of $291 per hr./$500K annually in Southeast
ARKANSAS: Average of $201 per hr./$352K annually, high of $225 per hr./$392K annually
FLORIDA: Average of $205 per hr./$359K annually, high of $291 per hr./$500K annually in Southwest Coast
GEORGIA: Average of $220 per hr./$384K annually, high of $250 per hr./$432K annually, $430K+ annually in Atlanta
LOUISIANA: Average of $214 per hr./$374K annually, high of $250 per hr./$432K annually
MISSISSIPPI: Average of $250 per hr./$432K annually, high of $300 per hr./$515K annually on Gulf Coast
NORTH CAROLINA: Average of $210 per hr./$367K annually, high of $225 per hr./$392K annually
SOUTH CAROLINA: Average of $200 per hr./$351K annually, high of $291 per hr./$500K annually
TENNESSEE: Average of $200 per hr./$351K annually, high of $260 per hr./$440K annually
 The Midwest is closing in (despite dodgy numbers in closed-mouthed Ohio) due to the boom state of North Dakota and increases throughout the region.
ILLINOIS: Average of $214 per hr./$374K annually, high of $291 per hr./$500K annually, $325K annually in Chicago
INDIANA: Average of $197 per hr./$346K annually, high of $260 per hr./$450K annually
IOWA: Average of $194 per hr./$340K annually, high of $272 per hr./$468K annually
KANSAS: Average of $200 per hr./$351K annually, no significant highs
KENTUCKY: Average of $200 per hr./$351K annually, high of $230 per hr./$394K annually
MICHIGAN: Average of $175 per hr./$310K annually, high of $192 per hr./$338K annually, $340K annually in Upper realm
MINNESOTA: Average of $175 per hr./$310K annually, high of $200 per hr./$351K annually
MISSOURI: Average of $210 per hr./$367K annually, high of $300 per hr./$515K annually, $275 per hr. in St. Louis
NEBRASKA: Average of $200 per hr./$351K annually, no significant highs
NORTH DAKOTA: Average of $208 per hr./$365K annually, high of $291 per hr./$500K annually
OHIO: Average of $186 per hr./$328K annually, no significant highs
SOUTH DAKOTA: N/A
WISCONSIN: Average of $223 per hr./$390K annually, high of $300 per hr./$515K annually, $300K annually in Madison/Milwaukee
 Texas, New Mexico, and California drive the high dollars in the Western region, with dramatic lows in Colorado, Arizona, and Hawaii.
ARIZONA: Average of $160 per hr./$286K annually, high of $225 per hr./$392K annually in Kingman, $250K annually in Phoenix
CALIFORNIA: Average of $220 per hr./$384K, high of $291 per hr./$500K annually, $500K annually in Los Angeles
COLORADO: Average of $150 per hr./$269K annually, no significant highs
HAWAII: Average of $140 per hr./$253K annually, no significant highs
NEVADA: Average of $195 per hr./$343K annually in Las Vegas, no significant highs
NEW MEXICO: Average of $224 per hr./$390K annually, high of $308 per hr./$525K annually in Roswell/Carlsbad area
OKLAHOMA: Average of $210 per hr./$367K annually, high of $220 per hr./$367K annually
TEXAS: Average of $242 per hr./$419K annually, high of $300 per hr./$515K annually, $450K annually in Houston and Dallas, $380K annually in San Antonio and Austin
UTAH: N/A
 The Middle Atlantic states experienced about a 10 percent earnings hike but primarily in Pennsylvania, with other states staying mostly the same.
DELAWARE: Average of $180 per hr./$318K annually, no significant highs
DISTRICT OF COLUMBIA: Average of $132 per hr./$240K annually, no significant highs
MARYLAND: Average of $155 per hr./$278K annually, high of $200 per hr./$351K annually in Cumberland region
NEW JERSEY: Average of $180 per hr./$318K annually, high of $200 per hr./$351K annually
PENNSYLVANIA: Average of $200 per hr./$351K annually, high of $230 per hr./$400K annually, $375K annually in Pittsburgh, $300K annually in Philadelphia
VIRGINIA: Average of $194 per hr./$341K annually, high of $256 per hr./$442K annually
WEST VIRGINIA: Average of $175 per hr./$310K annually, no significant highs
 The Northeastern states also remain predominately the same, with increases in New Hampshire and New York.
CONNECTICUT: Average of $175 per hr./$310K annually, no significant highs
MAINE: Average of $150 per hr./$271K annually, no significant highs
MASSACHUSETTS: Average of $170 per hr./$302K annually, high of $225 per hr./$392K annually, $150–$179 per hr. in Boston
NEW HAMPSHIRE: Average of $180 per hr./$318K annually, no significant highs
NEW YORK: Average of $168 per hr./$299K annually, high of $225 per hr./$392K annually, $270K annually in New York City
RHODE ISLAND: Average of $155 per hr./$278K annually, no significant highs
VERMONT: Average of $180 per hr./$318K annually, no significant highs
 Nothing seems to change in the Pacific Northwest, land of low incomes and high mountains.
ALASKA: Average of $140 per hr./$253K annually, no significant highs (or jobs for that matter)
IDAHO: Average of $135 per hr./$245K annually, no significant highs (or jobs for that matter)
MONTANA: Average of $175 per hr./$310K annually, no significant highs (or jobs for that matter)
OREGON: Average of $176 per hr./$312K annually, no significant highs (or jobs for that matter)
WASHINGTON: Average of $185 per hr./ $296K annually, high of $250 per hr./$400K annually
WYOMING: Average of $185 per hr./$327K annually, high of $230 per hr./$400K annually
Trends
- The percentage of jobs open to primary care–boarded physicians is 37 percent, up 6 percent from last year.
- Sign-on bonuses are increasing, with the average at $25K and the high at $50K; most do not include relocation. It is difficult to pinpoint the percentage of employers that offer sign-ons, but it is around 75 percent.
- The good news is that emergency physician incomes are up 10 percent across the board from last year.
- The benchmark of $200 per hour continues to prevail, spreading into the Middle Atlantic but remaining elusive in the Northeast and Pacific Northwest.
- Regional averages show the Southeast still leads in highest average compensation but is followed closely by the Midwest and Western states.
Top 10 States for Compensation
- Mississippi
- Texas
- New Mexico
- Wisconsin
- California
- Georgia
- Illinois
- Louisiana
- Oklahoma
- Missouri
Bottom 10 States for Compensation
- District of Columbia
- Idaho
- Hawaii
- Colorado
- Maine
- Washington
- Maryland
- Arizona
- New York
- Massachusetts
Pages: 1 2 3 | Multi-Page


One Response to “2015 Emergency Physician Compensation Report Highlights Regional Salary Trends”
November 15, 2015
ScottThis information would be much more useful if some information regarding cost-of-living/malpractice insurance and tax burden were included. Without this important context, it is difficult to compare these income numbers in a meaningful way.