Emergency departments have become overall diagnostic and treatment centers of excellence and availability in the American health care system. This role has been accentuated in the high-acuity era of COVID-19.
Explore This Issue
ACEP Now: Vol 40 – No 02 – February 2021With the surge of telemedicine and other virtual connections with the health system, the ongoing need for centers that provide immediate and unscheduled diagnostic testing to appropriately diagnose and manage new illnesses and injuries has only grown.
The Emergency Department Benchmarking Alliance (EDBA) measures ED utilization of diagnostic testing as the number of procedures performed per 100 patients seen. The latest survey for the year 2019 uses data from approximately 1,000 emergency departments that together saw 50 million patients and reports the results in cohorts based on facility type and on volume of patients seen in those departments (see Table 1).1 These data that capture ongoing changes in utilization and ED flow provide important insights for ED leaders. It is important to note that a variety of quality measures are in place to quantify the use of diagnostic procedures by emergency departments and individual practitioners. While utilization data are a key component of quality measurement, it is essential to consider the differences in the patient population being served by various facilities when any comparisons are made.
Table 1: 2019 ECG and Imaging Procedure Utilization
| ED Type | ECGs per 100 Patients | MRI Procedures per 100 Patients | Ultrasound Procedures per 100 Patients | CT Procedures per 100 Patients | Simple Radiograph Procedures per 100 Patients |
|---|---|---|---|---|---|
| All EDs (n=1,400) | 28 | 1.8 | 7 | 27 | 48 |
| Under 20k Volume | 22 | 0.6 | 4 | 18 | 37 |
| 20–40k | 25 | 1.5 | 6 | 20 | 41 |
| 40–60k | 28 | 1.5 | 9 | 25 | 45 |
| 60–80k | 30 | 2.5 | 10 | 29 | 48 |
| 80–100k | 37 | 2.5 | 9 | 30 | 53 |
| Over 100k Volume | 35 | 3.3 | 8 | 20 | 40 |
| Pediatric EDs | 3 | 1 | 5 | 5 | 26 |
| Adult EDs | 35 | 2.5 | 6 | 36 | 50 |
| Freestanding EDs | 16 | 4 | 12 | 36 |
Diagnostic Test Utilization
Use of diagnostic testing was first reported by the EDBA in ACEP Now in 2017.2 Table 1 shows EDBA data on the utilization of diagnostic testing based on volume of patients served and population served. There have been significant increases in use of diagnostic testing in adult-serving emergency departments compared to facilities serving pediatric populations. For example, pediatric emergency departments only use CT imaging procedures approximately four times per 100 patients seen, while adult-serving emergency departments have 32 uses per 100 patients. Emergency departments with annual volumes over 40,000 patients also turn to testing more frequently.
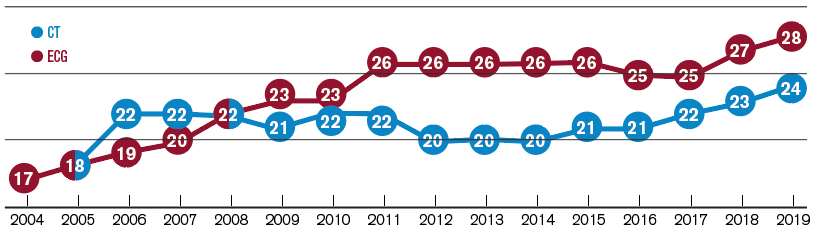
(click for larger image) Figure 1: ECG and CT Utilization per 100 Patients
Utilization of ECGs also continues to increase, according to EDBA figures (see Figure 1), reflecting the increasing percentage of older patients being evaluated in emergency departments and our improved understanding of the variation in how acute coronary syndromes can present.
There is also a trend of increasing utilization of CT scans (see Figure 1), ultrasound, and MRI imaging. MRI utilization across all emergency departments has now grown to around two per 100 patients, and up to 2.5 in higher-volume emergency departments and trauma centers where acuity (and resource availability) may be higher.
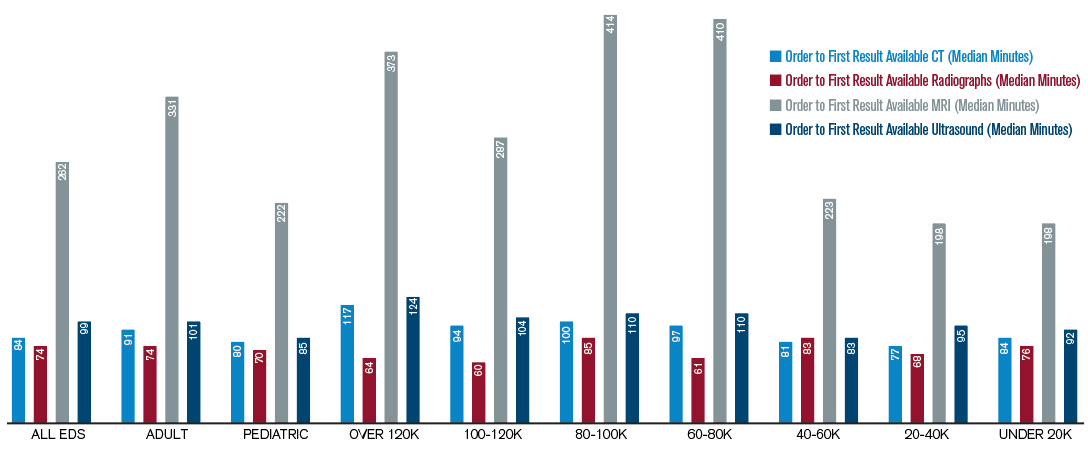
(click for larger image) Figure 2: Median Diagnostic Imaging Turnaround Times (Minutes)
To further characterize performance, hospitals were sorted based on trauma center designation. CT scans are used more frequently in Level I and II trauma centers, especially in facilities that also serve as high-level stroke centers and see a greater proportion of adults. There are 31 CT procedures per 100 patients in Level I and II trauma centers, and around 22 procedures in lower-level and nontrauma centers. ED leaders should be aware of the differences and, when called upon to study institutional utilization, should compare their experience to cohorts at a similar level of trauma designation and pediatric mix.
Diagnostic Imaging Turnaround Times
In 2019, EDBA assembled its first collection of data on turnaround times for select radiology and laboratory metrics. Turnaround time is defined as the median time interval from order placed in the electronic health record by the ED staff to first result available to the ED staff. For imaging procedures, this may be when the “preliminary” or “final” results are available, depending on the emergency department’s policy of decision making for a given imaging modality. The intervals are presented in Figure 2 for routine radiographs, CT scans, MRI scans, and ultrasound procedures, with all displayed as median time elements in minutes. There are important time differences, and like many other elements of ED processing, they are shorter in the lower-volume emergency departments. Because this is the first year this data set has been reported, there are no trending graphs.
The emergency department is the diagnostic center for the medical community. This role is particularly important for patients who have the greatest need for timely evaluation and treatment and might require hospitalization.
The emergency department is the diagnostic center for the medical community. This role is particularly important for patients who have the greatest need for timely evaluation and treatment and might require hospitalization. Because about 67 percent of inpatients are processed through the emergency department, emergency physicians are responsible for a disproportionate share of diagnostic testing and related patient flow issues.
Emergency physicians should understand the typical utilization rates and turnaround times for diagnostic testing in their department. Now, thanks to new data, departments can see how their utilization practices compare to similar ones around the nation. It is hoped that this will allow better decision making about diagnostic imaging use as a marker of quality and lead to productive discussions with the hospital’s imaging department about ensuring turnaround times are appropriate.
References
- Yiadom MYAB, Napoli A, Granovsky M, et al. Managing and measuring emergency department care: results of the fourth Emergency Department Benchmarking Definitions Summit. Acad Emerg Med. 2020;27(7):600-611.
- Augustine JJ. Diagnostic testing in the ED supports development of new metrics as quality indicators. ACEP Now. 2017;34(7):21-22.
Pages: 1 2 3 | Multi-Page


One Response to “Statistical Trends of Diagnostic Testing in the Emergency Department”
August 25, 2022
Kevin Flaig M.D.Hi James,
I am an Emergency Medical Director in an Emergency department which sees approximately 50,000 per year. Our CT Utilisation is reported to be approximately 45 per 100. Our radiology colleagues have not noticed overutilization and it seems like we our ordering appropriately. I can’t believe our acuity is that much higher but I am not sure I have an answer to this issue.
What would be your interpretation of this? What should I do as a director to look into this?