You have probably noted in your practice that injured patients are not presenting to the emergency department nearly as frequently. The National Center for Health Statistics (NCHS) released its ongoing statistical survey of emergency department visits for 2015, identifying this fact on the long-term trendlines.
The 2015 National Hospital Ambulatory Medical Care Survey (NHAMCS) report is an extension of the survey process that began in 1992. It is used to identify trends in ED visits that are important for emergency physicians and public health practitioners to understand.
The year 2015 saw an estimated 137 million ED visits.1 The 20-year volume trend remains upward, at about 1.9 percent per year. Of those visits, the survey estimated that 38.9 million (28.4 percent of all ED visits) were for the category summarized as “injury, poisoning, and adverse effect-related.”
By comparison, in 2009, there were an estimated 45 million encounters for injuries. The relatively stable number of injured patients seen in the emergency department is noted in Table 1, and the decreasing trend in mix of injuries since 1992 is reflected in Figure 1. This trend likely reflects the success of many injury prevention programs, leading to an ED population distribution that is less “injured” and more “ill.”
Table 1. Estimated ED Visits for Injury and Percent of Overall ED Population
| Year | NHAMCS Estimated ED Visits for Injury (millions) | Injury Visits as % of all ED Visits |
|---|---|---|
| 1993 | 36.5 | 42.4 |
| 1994 | 39.6 | 42.4 |
| 1995 | 37.2 | 38.6 |
| 1996 | 34.9 | 38.7 |
| 1997 | 35.1 | 37 |
| 1998 | 37.1 | 37 |
| 1999 | 37.6 | 36.6 |
| 2000 | 40.4 | 37.4 |
| 2001 | 39.4 | 36.6 |
| 2002 | 39.2 | 35.5 |
| 2003 | 40.2 | 35.3 |
| 2004 | 41.4 | 37.6 |
| 2005 | 41.9 | 36.4 |
| 2006 | 42.4 | 35.6 |
| 2007 | 39.4 | 33.7 |
| 2008 | 42.4 | 34.3 |
| 2009 | 45.4 | 33.3 |
| 2010 | 37.9 | 29.2 |
| 2011 | 40.2 | 29.4 |
| 2012 | 37.4 | 28.5 |
| 2013 | 37.2 | 28.5 |
| 2014 | 40 | 28.3 |
| 2015 | 38.9 | 28.4 |
The reported injury count may even overstate the number of patients. The NCHS classifications of ED visits and chief complaints are very well structured. However, the injury count is higher than would typically be counted in most ED accounting systems. About 4.4 million of those visits were for issues that emergency physicians would not typically consider injuries, including “adverse effects of medical treatment,” “medical and surgical complications,” and “adverse drug effects.”
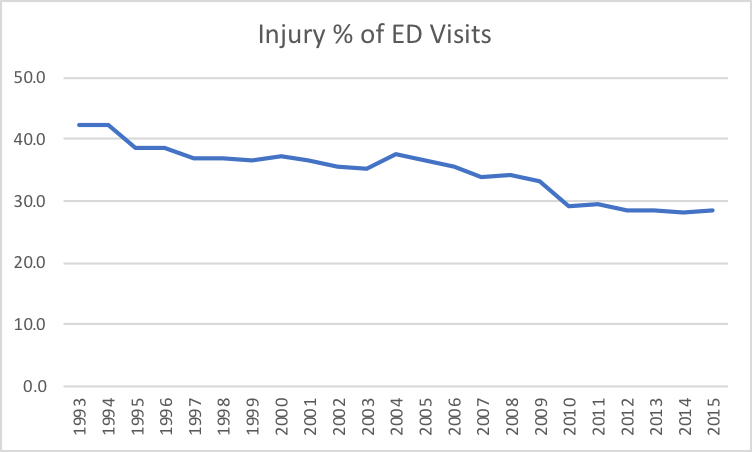
Figure 1. Injury as Percent of ED Visits
The leading causes of injury-related visits were falls (10.6 million visits, 26 percent of total injury visits) and motor vehicle traffic crashes (4.5 million visits, 11 percent of total injury visits).
Self-inflicted injuries accounted for 575,000 visits, with a volume that is increasing over the years. Self- inflicted injuries represented 0.4 percent of total injuries in 1992, and increased to 2 percent by 2011, where it has remained.
The highest injury incidence per age population was in those persons age 75 and older. This reflects the demographics of the American population. Reflecting the prevalence of aging for women, there were an estimated 1.9 million females over age 75 who were injured, versus 1.1 million males. The population incidence was 191 ED injury visits for women over age 75 and 154 for men. Injury prevention programs should target women in this older age group.
Work-related injuries seen in the emergency department continue a long-term decrease. This is reflected in the payer mix of patients. Worker’s compensation was the payor source for 3.9 percent of ED visits in 1995 (3.8 million visits), and that has decreased steadily over the last 20 years to 0.8 percent in 2015 (1.1 million visits). Work injury reductions are a huge public health success!
Multiple or system-wide injuries were the outcome in an estimated 8.4 million visits. Where there were isolated injuries, the count was highest for the upper extremity, with an estimated 6.2 million injury visits related to that area. Next was the lower extremity at 5 million visits, the head at 4.6 million, the torso at 1.6 million, and the spinal column at 1.5 million.
There is a continuing decrease in the prevalence of injuries presenting to the ED. This success story has continued for at least 23 years, and has been one important factor in the changing mix of ED patients.
Emergency physicians are important contributors to injury prevention programs of all types, and should consider this change in patient mix a tremendous success. There is always more work to be done. There is an opportunity to ask your emergency medicine and EMS colleagues to look at regional data and further efforts at injury prevention for the patient populations being served.
- Can the emergency department identify trends that would lead to improved public health programs targeted to the service community?
- Does the ED staff talk to elderly patients, particularly female patients, about reducing injuries?
- Where are the injury programs that can further target the parents and members of the pediatric population? This is the group that has life-long repercussions from significant injuries. Educational efforts that start with uniform application of child safety seats, use of safety helmets in appropriate activities, safe sports and recreational programs, and even the reduction in distracted walking and texting will continue the public health benefits of injury reduction.
In the ED, the bottom line is to expect more illnesses than injuries in the “patients to be seen” column of the tracking board.
Reference
- National Center for Health Statistics. National Hospital Ambulatory Medical Care Survey: 2015 Emergency Department Summary Tables. Centers for Disease Control and Prevention website. Available at
https://www.cdc.gov/nchs/data/nhamcs/web_tables/2015_ed_web_tables.pdf. Accessed July 22, 2018.
Pages: 1 2 | Multi-Page


No Responses to “Injury in the Mix: Changing Nature of ED Patients”