The Centers for Disease Control and Prevention (CDC) released its statistical survey of emergency department visits for 2016 on April 1. Called the National Hospital Ambulatory Medical Care Survey (NHAMCS), it is a wealth of information for emergency physicians and will guide the data and trends for the emergency services for which they are responsible.1
Explore This Issue
ACEP Now: Vol 38 – No 10 – October 2019The Numbers
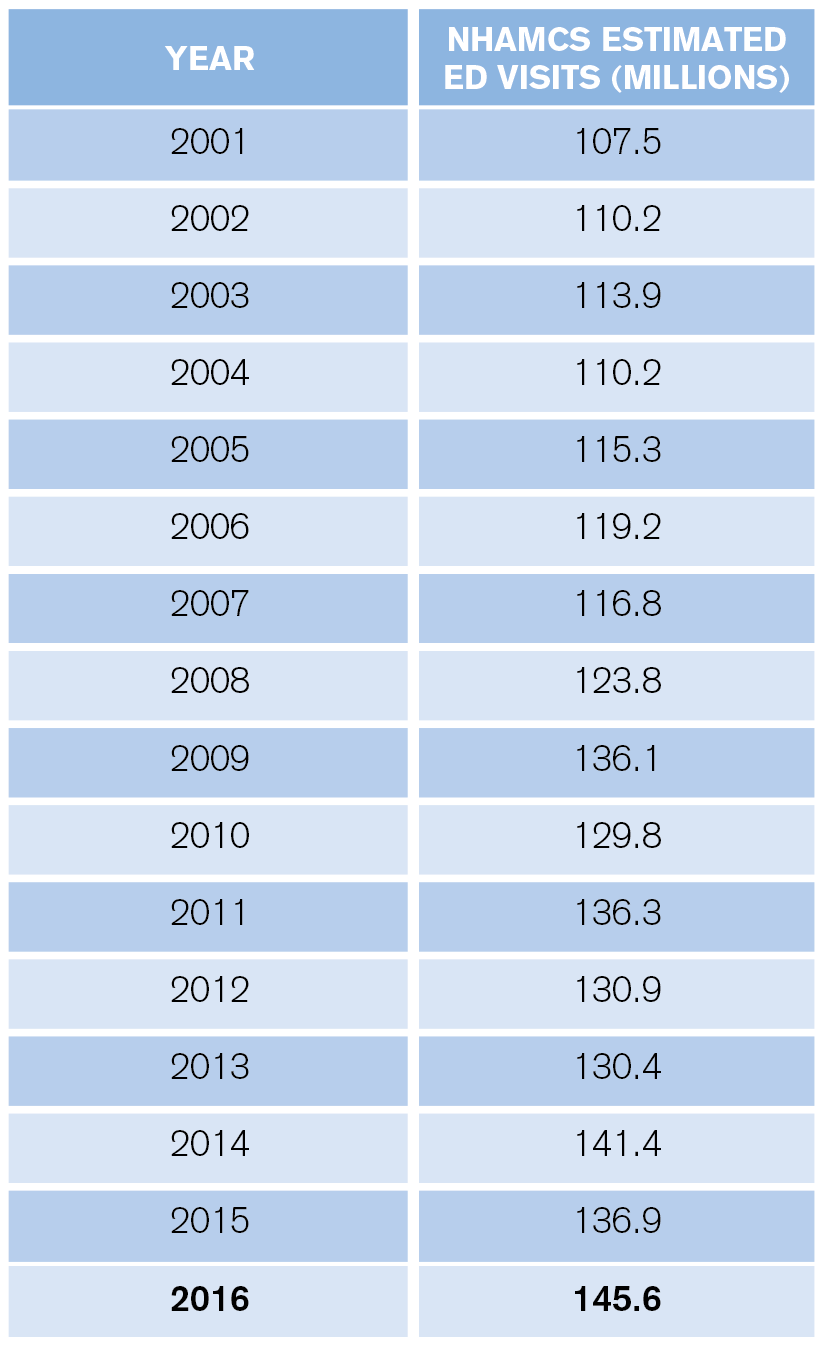
ED visit estimates increased from 136.9 million in 2015 to 145.6 million in 2016, a jump of 6.4 percent. The 10-year volume change is 24.7 percent, and for the past 20 years, the increase has totaled 61.2 percent (the 1996 ED visit estimate was 90.3 million). The past 15 years of volume estimates appear in Table 1.
These data may not match the experience in every emergency department and every community. First, the CDC typically estimates the lowest volume of ED visits, and the NHAMCS does not include visits to freestanding emergency departments. Second, there are changing patterns of ED use based on community sources of unscheduled care. Third, the patchwork of primary care systems in the country influences the number of ED visits locally.
What is apparent from the CDC data is that the trend of emergency departments seeing older, sicker patients, combined with continued growth in retail clinics, telehealth, and other sources of care for nonemergent problems, will yield a net increase in the average severity and complexity of patients seen in full-service emergency departments.
Who Are the Patients?
ED visits increased from 369 to 458 visits per 1,000 people between 1995 and 2016. High utilizers continue to include infants, nursing home residents, the homeless, black persons, and people over age 75.
Infants under age 1 had 987 visits per 1,000 persons. This is relatively high utilization and represents an opportunity for parent education.
There were roughly 2.2 million visits for patients who reside in nursing homes, for a utilization of 1,594 visits per 1,000 residents. Approximately 33 percent of nursing home patient ED visits resulted in hospital admission (739,000), with an average length of hospital stay of 5.7 days.
Persons classified as homeless represented a larger visit load for EDs compared with prior years. In 2016, homeless persons accounted for an estimated 1,446,000 visits, a rate of 2,630 visits per 1,000 estimated number of homeless persons. Those visits equal roughly 1 percent of total ED visits.
The CDC also categorized visit rates for white, black, Hispanic, and other races/ethnicities. The visit rate was 435 visits per 1,000 white people, 404 visits per 1,000 Hispanics, and 804 visits per 1,000 black people. The visit rate was 172 visits per 1,000 persons of other races (ie, Asian, native Hawaiian or other Pacific Islander, American Indian or Alaska native, and persons with more than one race).
The ED population is aging in line with national demographics. Persons over age 65 accounted for 15.8 percent of ED visits, and persons age 75 and older had 605 visits per 1,000 in 2016. Thus, emergency departments must prepare for larger numbers of patients and develop processes tailored to older persons. In addition, older patients require more workup, treatment, and, thus, more time in the department.
Finally, because older patients are admitted to the hospital more often, they spend more time as ED boarders. Planning for new or renovating old emergency departments should account for these shifting demographics.
Pages: 1 2 3 | Single Page


No Responses to “The Latest Emergency Department Utilization Numbers Are In”