Emergency departments continue to see growth in the number of patients they serve, stretching resources and capacity limits. However, there’s some good news (and a little troubling news) regarding the compensation emergency physicians receive for their hard work.
Explore This Issue
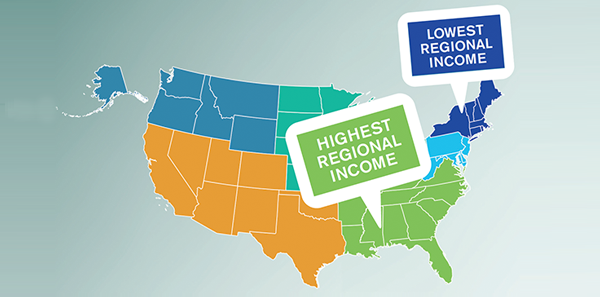
ACEP Now: Vol 35 – No 10 – October 2016This year’s report shows a compensation increase of 10.16 percent nationally, from highs of 13 percent in the Middle Atlantic and the Pacific Northwest to lows of 6 percent in the Northeast. The market continues to reflect the lack of standardization in the specialty, with jobs in areas with highly desirable lifestyles featuring significantly lower incomes than nearby positions in “geographically challenged” areas.
There are some overall trends that can spotted in our report:
- The percentage of jobs open to primary care boarded physicians is 45 percent, up 8 percent from last year.
- Sign-on bonuses are increasing, with the average at $25,000 and the high at $100,000; most do not include relocation costs.
- Scribes are becoming the norm, no longer a major plus, in emergency departments nationwide.
- The benchmark of $200 per hour continues to prevail, spreading into the Middle Atlantic but not translating to the Northeast.
- Urgent care jobs are rife in all states, with increasing incomes as high as $350,000.
The following regional numbers are based on 1,632 clinical hours per year and reflect all employment models, including employed directly and employed by a group or immediate care center, that were all input and averaged out. They include incentive bonuses and productivity components measured in relative value units (RVUs) where applicable. The picture of the emergency medicine market comes from data drawn from primary emergency medicine job websites, including EDPhysician.com, EDSource.com, EDOpenings.com, and ACEP’s Career Central, as well as from inquiries sent to all large national contract management groups. The annual incomes include a basic benefits package worth $25,000. Sign-on bonuses, loan assistance, and other perks are not included. Rankings are based on state averages rather than sporadic highs. (See Figure 1 for the top 10 and bottom 10 states in terms of overall compensation.)
The Southeast leads the country in compensation, with all state income averages well over $200 per hour and a regional income increase of just over 9 percent. However, Louisiana and North Carolina saw compensation drop this year.
ALABAMA: Average: $206/hr., $362,000 annually; high of $291/hr., $500,000 annually in the Gulf Coast
ARKANSAS: Average: $232/hr., $403,000 annually; high of $245/hr., $425,000 annually
FLORIDA: Average: $220/hr., $385,000 annually; high of $300/hr., $515,000 annually on the Gulf Coast
GEORGIA: Average: $240/hr., $417,000 annually; high of $291/hr., $500,000 annually
LOUISIANA: Average: $212/hr., $371,000 annually; high of $291/hr., $500,000 annually
MISSISSIPPI: Average: $255/hr., $441,000 annually; high of $291/hr., $500,000 annually on the Gulf Coast
NORTH CAROLINA: Average: $207/hr., $364,000 annually; no significant highs
SOUTH CAROLINA: Average: $220/hr., $384,000 annually; high of $270/hr., $466,000 annually
TENNESSEE: Average: $235/hr., $408,000 annually; high of $300/hr., $515,000 annually
The Midwest shows about a 9 percent increase across the region, with huge bumps in North Dakota (22 percent) and Ohio (15 percent), while Wisconsin experienced little change.
ILLINOIS: Average: $238/hr., $414,000 annually; high of $350/hr., $550,000 annually in central state
INDIANA: Average: $212/hr., $370,000 annually; high of $275/hr., $474,000 annually
IOWA: Average: $200/hr., $351,000 annually; high of $272/hr., $469,000 annually
KANSAS: Average: $222/hr., $387,000 annually; high of $250/hr., $433,000 annually
KENTUCKY: Average: $200/hr., $351,000 annually; no significant highs
MICHIGAN: Average: $185/hr., $328,000 annually; no significant highs
MINNESOTA: Average: $165/hr., $292,000 annually; high of $200/hr., $351,000 annually
MISSOURI: Average: $227/hr., $395,000 annually; high of $275/hr., $474,000 annually
NEBRASKA: Average: $200/hr., $351,000 annually; no significant highs
NORTH DAKOTA: Average: $263/hr., $455,000 annually; high of $265/hr., $457,000 annually
OHIO: Average: $219/hr., $382,000 annually; no significant highs
SOUTH DAKOTA: Data not available due to a lack of listed jobs
WISCONSIN: Average: $225/hr., $392,000 annually; high of $300/hr., $515,000 annually; $300,000 in Madison/Milwaukee
Middle Atlantic states experienced some big bumps—28 percent in Delaware and 12 percent in Virginia, with a region-wide increase of 13 percent.
DELAWARE: Average: $250/hr., $433,000 annually (based on one opening)
DISTRICT OF COLUMBIA: Average: $157/hr., $281,000 annually; no significant highs
MARYLAND: Average: $165/hr., $294,000 annually; no significant highs
NEW JERSEY: Average: $199/hr., $349,000 annually; no significant highs
PENNSYLVANIA: Average: $217/hr., $380,000 annually; high of $260/hr., $450,000 annually; $375,000 in Pittsburgh; $300,000 in Philadelphia
VIRGINIA: Average: $220/hr., $384,000 annually; high of $275/hr., $475,000 annually
WEST VIRGINIA: Average: $190/hr., $335,000 annually; no significant highs
WESTERN REGION: Texas, New Mexico, and California drive the high dollars in the Western region with 10 percent hikes, but the dramatic lows continue in Colorado, Arizona, and Hawaii.
ARIZONA: Average: $168/hr., $300,000 annually; high of $215/hr., $375,000 in Kingman; $250,000 in Phoenix
CALIFORNIA: Average: $241/hr., $418,000 annually; high of $270/hr., $465,000 annually in central inland areas
COLORADO: Average: $150/hr., $269,000 annually; no significant highs
HAWAII: Average: $140/hr., $253,000 annually; no significant highs
NEVADA: Average: $200/hr., $351,000 annually in Las Vegas; no significant highs
NEW MEXICO: Average: $228/hr., $398,000 annually; high of $308/hr., $525,000 for regional director
OKLAHOMA: Average: $203/hr., $356,000 annually; high of $230/hr., $400,000 annually
TEXAS: Average: $252/hr., $435,000 annually; high of $315/hr., $540,000 annually in El Paso; $450,000 in Houston and Dallas; $380,000 in San Antonio and Austin
UTAH: Data not available due to a lack of listed jobs
PACIFIC NORTHWEST REGION: There were big changes in the Pacific Northwest, with Washington salaries up 20 percent and Montana up 21 percent, taking the regional average to $190 per hour.
ALASKA: Average: $150/hr., $270,000 annually; high of $566,000 in Anchorage
IDAHO: Average: $140/hr., $253,000 annually
MONTANA: Average: $221/hr., $385,000 annually
OREGON: Average: $190/hr., $335,000 annually
WASHINGTON: Average: $231/hr., $400,000 annually; high of $400/hr. in Albany; $350,000 for urgent care
WYOMING: Average: $212/hr., $370,000 annually; no significant highs
The Northeastern states remain predominately the same, with only minor increases overall of just less than 6 percent, providing a regional average of $179 an hour—well below the rest of the country.
CONNECTICUT: Average: $185/hr., $327,000 annually; no significant highs
MAINE: Average: $176/hr., $288,000 annually; no significant highs
MASSACHUSETTS: Average: $185/hr., $327,000 annually; high of $400,000 in Cape Cod; $150–$179/hr. in Boston
NEW HAMPSHIRE: Average: $187/hr., $330,000 annually; no significant highs
NEW YORK: Average: $171/hr., $305,000 annually; high of $215/hr. in upstate residency; $270,000 in New York City
RHODE ISLAND: Average: $160/hr., $286,000 annually; no significant highs
VERMONT: Average: $192/hr., $338,000 annually; no significant highs

(click for larger image)
Figure 1. States Offering the Most and Least Compensation
Ms. Katz is president of The Katz Company EMC, a member of ACEP’s Workforce and Career sections, and a frequent speaker and faculty at conferences and residency programs. She can be reached at katzco@cox.net.
Pages: 1 2 3 | Multi-Page


6 Responses to “Emergency Physicians’ 2016–2017 Compensation Report Shows Lack of Standardization for Specialty”
October 24, 2016
JohnIn North Dakota, the average is higher than the high.
October 25, 2016
Dawn Antoline-WangThank you. The average and high were mistakenly transposed for North Dakota, and have been corrected above.
November 22, 2016
Rob Vis the gulf coast numbers right for florida? 150K with surrounding states having 500k for gulf coast?
November 27, 2016
John SilvarmanGarbage in, garbage out. Average salaries she quotes in my regional area are about $100K lower than quoted here. This just inflames those around me
March 22, 2017
Josh YI think there is a typo on the Florida states: “FLORIDA: Average: $220/hr., $385,000 annually; high of $300/hr., $150,000 annually on the Gulf Coast”. $150,000 on the Gulf Coast at the high end? This doesn’t make sense. On the 2015 report the number was reported as $500,000. What is the correct number for 2016?
March 27, 2017
Dawn Antoline-WangThank you for pointing this out. The correct high is $515,000. I have updated the article.