The Centers for Disease Control and Prevention (CDC) recently released its ongoing statistical survey of emergency department visits for 2013 and 2014, finding that ongoing volume increases took place on the long-term trendlines. The calendar year 2014 ED summary tables are available here.
Explore This Issue
ACEP Now: Vol 36 – No 11 – November 2017The 2014 report is an extension of the survey process that began in 1992. It is used to identify trends in ED visits that are important for emergency department, hospital, and public health practitioners to understand. The 2014 data report is based on a sampling of 23,844 ED patient care reports from 283 emergency departments. National population census data were used to estimate utilization of ED services by populations.
The year 2014 saw the highest estimated volume of ED visits ever, an increase to 141.4 million compared to 130.4 million in 2013. The 20-year volume trend remains upward, at about 1.9 percent per year. ED utilization averages approximately 451 visits per 1,000 persons.
Reflecting the demographics of the American population, 15.4 percent of ED visits are from seniors older than age 65, and 19.6 percent are from pediatric patients (defined by the National Hospital Ambulatory Medical Care Survey [NHAMCS] as younger than age 15). An estimated 4.3 percent of ED visits were nonurgent, with the highest rates of these visits from pediatric patients.
High-utilizers continue to be nursing home residents, who accounted for about 2.5 million visits, with a utilization of 1,787 visits per 1,000 residents. About 30 percent of nursing home patient ED visits resulted in hospital admission (756,000), with an average length of stay in the hospital of 7.4 days.
The year 2014 was also the year that the Affordable Care Act placed insurance expansion into effect. It marks the first year in the CDC survey years that Medicaid and the Children’s Health Insurance Program (CHIP) accounted for the largest expected source of payment, at 34.9 percent. Next, was private insurance at about 34.6 percent of ED visits, with Medicare at 17.5 percent, and no insurance equaling 11.8 percent. Figure 1 reflects the trend in the payer mix over the years of CDC data collection. The trend continues for decreased use of emergency departments by patients who identified workers’ compensation as the source of payment, which is down to 0.8 percent. The most frequent payer type for admission to the hospital through the emergency department was Medicare (48 percent), followed by private insurance (42 percent), Medicaid or CHIP or other state-based program (22 percent), and no insurance (5.2 percent).
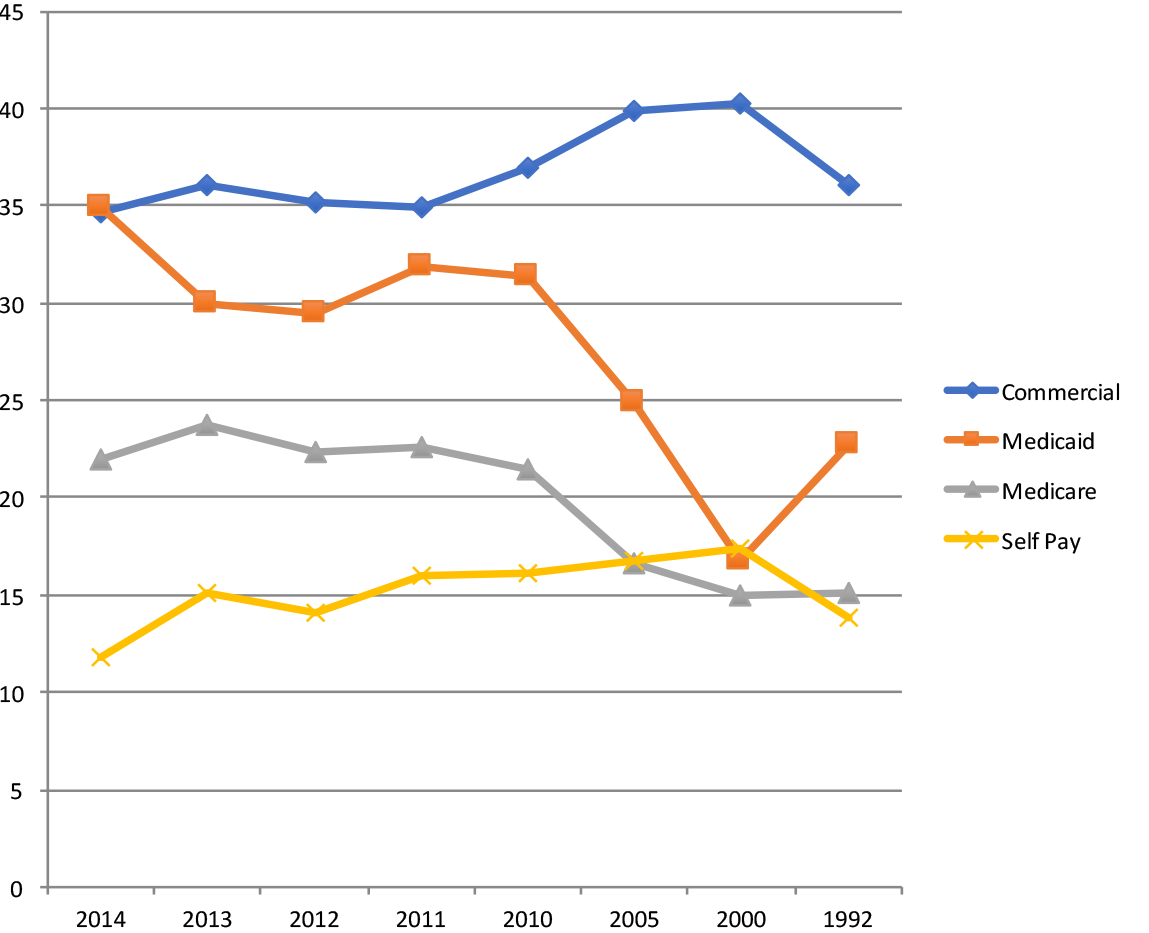
(click for larger image) Figure 1: Percentage of ED Visits by the Major Payers Over the Years of the CDC Data Survey (from newest to oldest)
Injuries accounted for an estimated 40 million visits, or 28.3 percent of ED visits. The highest injury rates were in those age 75 and older. By comparison, in 2009, there were an estimated 45 million encounters for injuries. This trend reflects the success of many injury prevention programs, leading to an ED population distribution that is less injured and more ill. The leading causes of injury visits were falls (10.6 million visits, 25 percent of total injury visits) and motor vehicle traffic crashes (4 million visits, 9.6 percent of total injury visits). Self-inflicted injuries or poisonings accounted for 468,000 visits.
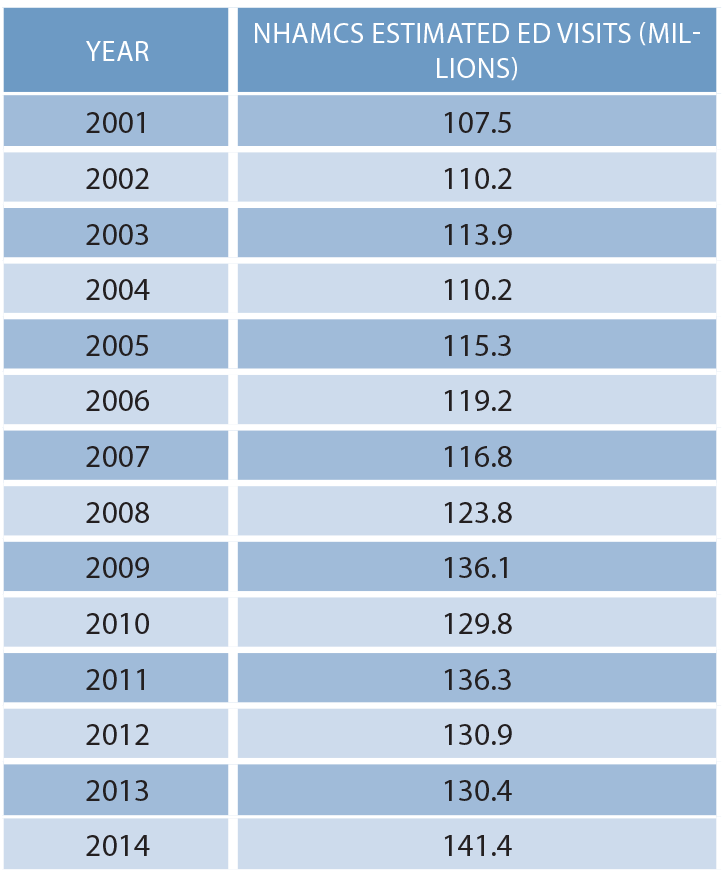
(click for larger image) Table 1. Estimated ED Visits
There are growing numbers of patient visits related to primary mental health issues. In about 1.6 million visits, a mental health provider saw the patient in the emergency department, and in about 1.2 million ED visits, the result was admission to the mental health unit of a hospital.
A total of 15.6 million ED visits resulted in hospital admission, transfer, or death. However, in 2014, the number of ED visits with a disposition of died in the emergency department is too low to be estimated. About 8 percent of all ED visits resulted in hospital admission. Placement in observation units accounted for an additional 1.3 percent of all ED visits. The average hospital length of stay for patients admitted through the emergency department was 4.8 days.
There are a number of hospital quality indicators related to readmissions to the hospital, so ED leaders must be aware of the baseline level of activity for this. In approximately 3.5 percent of visits (compared to 4.7 percent in 2011) resulting in hospital admission, the patient had been seen in the same emergency department within the prior 72 hours. About 3.6 percent of visits were made by patients who had been seen in the same emergency department in the preceding 72 hours, and the CDC estimates that 4.9 percent of ED visits were for follow-up.
The use of CT scanning appears to have plateaued, but MRI and other special imaging procedures like ultrasound are increasing.
There is a continuing growth in the percentage of overall hospital admissions presenting through the emergency department. The Emergency Department Benchmarking Alliance (EDBA) data survey finds that about 66 percent of hospital inpatients are processed through the emergency department. This clearly demonstrates that the emergency department is the “front door” of the hospital.
Summary Talking Points from NHAMCS and EDBA Data
The data indicate that the emergency department is an important and valuable element of the health care system.
- There is a long-term trend that American emergency departments are seeing at least 2 percent more visits per year.
- More patients arrive with medical illnesses than injuries.
- More patients are elderly and arrive by EMS.
- For the first time, the largest group of patients being seen in the emergency department has Medicaid or CHIP insurance.
- The highest utilization rate of emergency services per population is by nursing home residents.
- Admission rates are falling except in the mental health group.
- About 3.5 percent of ED visits resulting in hospital admission were for patients who had been seen recently in the same emergency department.
Pages: 1 2 3 | Multi-Page


No Responses to “Emergency Department Volume Increase Trend Continues Into 2014”