The number of patients seen in U.S. emergency departments has been steadily increasing since World War II. The volume estimates for ED visits are calculated by a number of organizations, and the trends look similar.
Explore This Issue
ACEP Now: Vol 39 – No 05 – May 2020But now COVID-19 has happened. It is possible, and even likely, that the significant changes in the American health system that follow the novel coronavirus pandemic will result in very different methods of providing unscheduled and emergency care. And those changes will finally transform the 75-year trend of increasing ED visits.
Three organizations provide estimates of U.S. ED visits. They use different survey techniques and different definitions of what constitutes an emergency department. The 2001–2017 ED visit estimates from the Centers for Disease Control and Prevention (CDC), American Hospital Association (AHA), and Emergency Medicine Network (EMNet) are summarized in Table 1, which are the latest data available for two of the organizations. The AHA has also reported data for the 2018 year.
The inclusion of freestanding emergency departments makes the EMNet data collected through its National Emergency Department Inventory (NEDI)-USA surveys the comprehensive picture of patients seen in all sites in the United States referred to as “emergency departments.” The CDC uses census data and sampling to estimate ED volumes only in full-service, hospital-based emergency departments. It has provided the best trending data since 1992. The AHA does annual comprehensive data gathering from its members, and it has accurate data for all members, with a very stable number of emergency departments. NEDI-USA data incorporate the contribution of freestanding emergency departments to the overall visit numbers.
The CDC statistical survey of ED visits, which is part of the National Hospital Ambulatory Medical Care Survey (NHAMCS), has been a wealth of information for emergency physicians about trends in ED visits. The CDC estimated that 139 million visits took place in 2017. The 10-year volume change was 19 percent, and over the last 20 years, volume increased 46 percent.
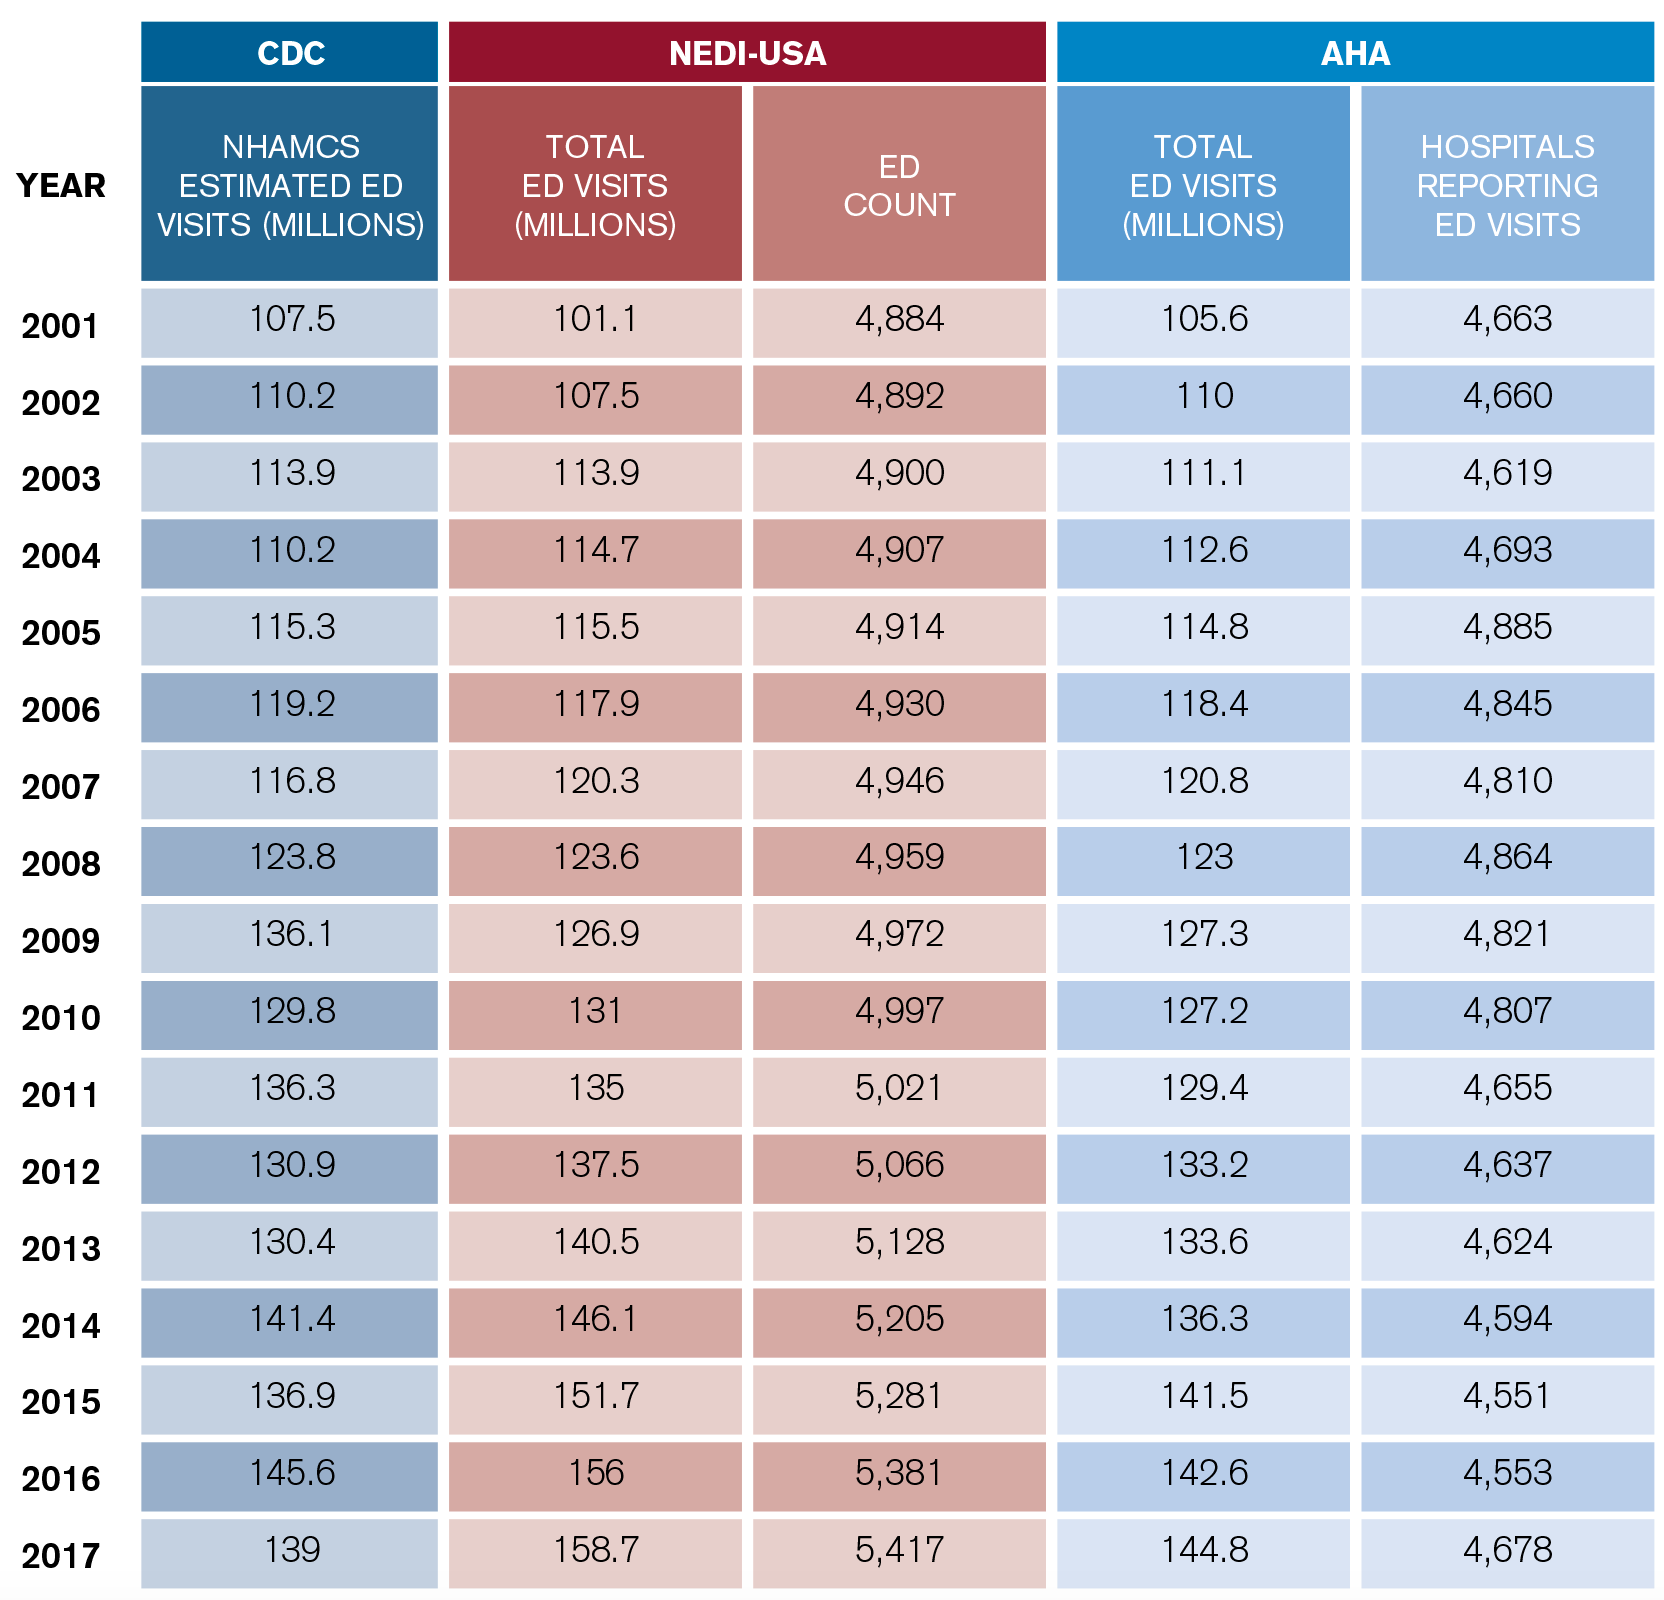
(click for larger image) Table 1. Emergency Departments and Emergency Visits 2001–2018
The AHA provides a data summary of community hospitals, which it defines as nonfederal, short-term general, and other specialty hospitals. It counted 2017 visits at 142.6 million in 4,678 emergency departments. The 10-year volume change was 20 percent.
The NEDI-USA database is maintained by EMNet at Massachusetts General Hospital in Boston. NEDI-USA contains data on all U.S. emergency departments open since 2001. EMNet results include all known freestanding emergency departments. According to NEDI-USA, there were 5,417 U.S. emergency departments and 158.7 million total U.S. ED visits in 2017. The 10-year volume change was 32 percent.
Bottom line: The trend of emergency departments seeing older, sicker patients, combined with continued growth in retail clinics, telehealth, and other sources of care for nonemergent problems, has yielded a net increase in severity/complexity for full-service emergency departments.
Key Planning Elements
There were approximately 450 ED visits per 1,000 people in 2017. High utilizers continued to include infants, nursing home residents, the homeless, blacks, and people over age 75. Persons over age 65 accounted for 15.8 percent of ED visits, and persons age 75 and older had 605 visits per 1,000 in 2016. A mere 4.3 percent of ED visits classified as nonurgent (the highest rates of these visits were for patients under age 15). Injuries accounted for an estimated 29 percent of ED visits, reflecting an ED population distribution that featured less injury and more illness.
The leading cause of ED visits for injuries was falls. When viewed through the lens of “presenting complaint,” stomach and abdominal pain were the most common in 2017, accounting for around 9 percent of visits. Chest pain was next highest, at 5 percent. There continues to be an increasing presence of mental disorders noted in ED patients.
There is an ongoing increase in use of diagnostic tools in emergency departments, especially electrocardiograms. Use of computed tomography scanning appears to have plateaued, but the use of magnetic resonance imaging and other special imaging procedures (such as ultrasound) are increasing.
The ED Benchmarking Alliance performs a data survey that reports on ED performance measures. That data survey finds that roughly 69 percent of hospital inpatients are processed through the emergency department. This clearly demonstrates the emergency department has become the front door to the hospital.
Planning for the Future
The demand for emergency services has continued to rise, especially for patients who are older, sicker, and in need of high-level diagnostic services and hospital admission. And the current challenges of the coronavirus pandemic put the emergency department clearly in the spotlight as the responsible entity for crisis care.
However, the long-term volume growth in American emergency departments may be tempered by the use of telemedicine services that will grow tremendously in the coming months.
Regardless, emergency physicians must trumpet the emergency department’s value to hospital and community leaders so the improvements needed to deliver care in a safe and effective manner will be prioritized.
Reference
- Rui P, Kang K. National Hospital Ambulatory Medical Care Survey: 2017 emergency department summary tables. CDC website.
Pages: 1 2 3 | Multi-Page


No Responses to “Emergency Department Usage Trends Before COVID-19”