Explore This Issue
ACEP Now: Vol 33 – No 08 – August 2014The design of emergency departments (EDs) is evolving with the changes in patients served, diagnostic testing utilized, and the process of managing higher volumes of patients.
The National Hospital Ambulatory Medical Care Survey has been providing insight into ED patient volume, acuity, testing, treatment, and disposition since 1992. The 2010 summary tables of this survey have been published,1 and the 2011 data tables will be released shortly. The survey has recorded growth in patient volumes of between 2.5 and 3 percent per year since 1992. The number of EDs has not been increasing, and this steady growth in patient volume has challenged the physical resources of many departments in the United States.
The roles of the ED as a diagnostic center, a buffer for many other hospital units, and the boarding center for admitted patients all combine to change ED design needs. Because 68 percent of inpatients are processed through the ED, boarding of admitted patients poses significant flow challenges if there is little space for patients.
The Emergency Department Benchmarking Alliance (EDBA) is now reporting on the data survey for 2013, with data from 1,100 EDs that saw 42 million patients.2 The results of this survey allow ED leaders to find data to support renovation and redesign projects.
Many hospital CEOs will insist that the ED be built for 2,000 encounters per bed because that rate is a known fact. Like many “facts” about the ED, this one is wrong.
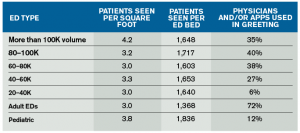
The most common data parameters used to guide ED design are the number of visits per patient care space and visits per square foot. The figures in Table 1 reflect the results of the EDBA survey in the design area and the use of team triage intake processes. EDs are built (and typically expanded a few times) into a physical space that contains a gross square footage, but more functional metrics, such as visits per square foot, are often not considered. The visits per square foot is calculated by dividing the annual patient volume by the square footage. It is a crude surrogate for how space compact an ED really is. It has not been reported in any available literature.
Most EDs are sized so they see 3 to 3.5 visits per square foot. Small EDs generally have a relatively larger size. For those EDs that are very small relative to volume, the space compression can result in higher walkaway rates. More visits are seen per square foot in EDs with volumes of more than 100,000 patients and in pediatric EDs.
There is currently no basis to compare these numbers, but most emergency physicians realize that an ED with an unusually small footprint is noisy, is cramped, has relatively little privacy, and has little room for families. It is possible that sophisticated analysis would show that these EDs have higher infection rates, lower rates of staff satisfaction due to cramped workspaces and constant noise, and less need for sophisticated staff communication systems. EDs that have a very low number of visits per square foot need sophisticated staff communication systems, Segway transporters for the physicians, and monitor systems that will help patients or families not get lost.
Visits per patient care space is calculated by dividing the annual patient volume by the number of patient care spaces. The number of beds is often used as the number of patient care spaces, and in some states that is the number that is licensed. Because many EDs now designate spots for care that are not beds, the more useful term is patient care spaces. The definition will include all spots, including chairs and vertical treatment areas used routinely for patient care.
The ED cohorts average 1,350 to 1,750 visits per patient care space. The exception is pediatric EDs, which flow patients more quickly, resulting in about 1,800 visits per patient care space. Small EDs tend to have a relatively smaller number of patients seen per care space. Those EDs that have high numbers of visits per bed generally have higher walkaway rates. For full-service EDs that saw more than 1,900 visits per space, the walkaway rate jumps.
Note that many people were in hospital administrator school when the visit rates were reported at 2,000 patient encounters per bed. There are many hospital CEOs who will insist that the ED should be built to those visit rates because that is a known fact. Like many other “facts” about the ED, this one is wrong.
There are many areas that now design their space and process to essentially eliminate triage process and space. These new processes use a greeting model that is expanded beyond traditional nurse-based triage, including initial treatment decision-making. In EDs over 40,000 volume, there is a growing use of team triage models, which feature emergency physicians or advanced practice providers (APPs). The higher the volume, the more likely it is that the ED is using either physicians or APPs in the greeting model.
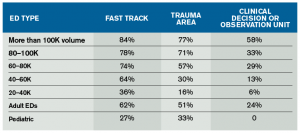
There are important decisions that must be made about the design of functional areas within or around the ED. Many EDs have patient volumes and needs that justify the development of fast-track areas for low-acuity patients, trauma-receiving areas, mental health suites for safe management of those patients, and clinical decision or observation units. Most EDs that see more than 40,000 patients per year have one or more of these functional areas. Smaller-volume EDs typically don’t have the need for designated service areas. Functional areas are reported in Table 2.
Emergency physicians and ED leaders must able to use and understand the elements of ED design that provide an environment for high-quality emergency care and have comparison data available for their peers. This will accommodate higher patient volumes, acuity, and management of patients through the diagnostic and treatment phase of their emergency care.
References
- Centers for Disease Control and Prevention. National Hospital Ambulatory Medical Care Survey: 2010 Emergency Department Summary Tables. CDC Web site. Available at: http://www.cdc.gov/nchs/data/ahcd/nhamcs_emergency/2010_ed_web_tables.pdf. Accessed July 16, 2014.
- The Emergency Department Benchmarking Alliance. Available at: www.EDBenchmarking.org.
 James J. Augustine, MD, FACEP, is director of clinical operations at EMP in Canton, Ohio; clinical associate professor of Emergency Medicine at Wright State University in Dayton, Ohio; vice president of the Emergency Department Benchmarking Alliance; and on the ACEP Board of Directors.
Pages: 1 2 3 | Multi-Page


One Response to “Emergency Department Benchmarking Alliance Reports on Data Survey for Next-Generation ED Design”
October 12, 2015
How San Diego's Emergency Room Wait Times Stack Up[…] public and potential patients had access to it,” said Dr. James Augustine, vice president of the Emergency Department Benchmarking Alliance, a panel of ED care experts developing better measures to evaluate care provided by emergency room […]