The role of the emergency department (ED) and emergency physicians has been made dramatically more important due to the pandemic.
Explore This Issue
ACEP Now: Vol 41 – No 08 – August 2022Performance of EDs in 2020 and into 2021 changed abruptly due to the pandemic, with subsequent changes in health care delivery and incidence of certain diseases. The members of the ED Benchmarking Alliance (EDBA) are surveyed annually and those surveys provide insight into important trends in ED operations. Definitions have been previously published.1
From the results of the 2021 EDBA performance measures survey, EDs are seeing higher acuity, more adults, more EMS patients, making more use of diagnostic tests, transferring more ED patients, and boarding the early time of patients who are in need of inpatient services.
Large losses in patient volume, which began in 2020, started to reverse in 2021. After volume drops of about 15–20 percent in overall ED volumes in 2020 compared to 2019, volumes recovered in 2021 to about a five to 10 percent decrease from 2019 volumes.
Patient acuity increased, as measured by physician level of service and by the percentage of patients that were admitted to the hospital from the ED. There are ongoing indications that patient acuity is increasing across all sizes and types of full-service EDs. The cohort system used in the EDBA survey process has data comparators for adult and pediatric EDs, and for EDs that see patients in 20,000 volume bands. Higher volume EDs reported disproportionately higher acuity, higher use of diagnostic testing, and longer patient processing times.
There is a significantly lower percentage of children presenting to EDs that are not designated as children’s hospitals, as I described in my previous article. For general community EDs, the decrease in visits by patients under age 18 has moved from about 16 percent in 2020 to about 13 percent in the data for 2021.
Patient arrival by EMS increased, and more of those patients were admitted. About 19 percent of ED arrivals in 2021 came by ambulance and 37 percent of those patients were subsequently admitted.
ED patient intake processing remained intact, which is an incredible accomplishment in a very difficult year. “Door to Bed” time remained stable with a median time of about seven minutes, and “Door to Doctor” time at about 12 minutes. The long-term trends for these metrics remained intact, as they have decreased in most years since 2008 when the intake time was about 41 minutes.
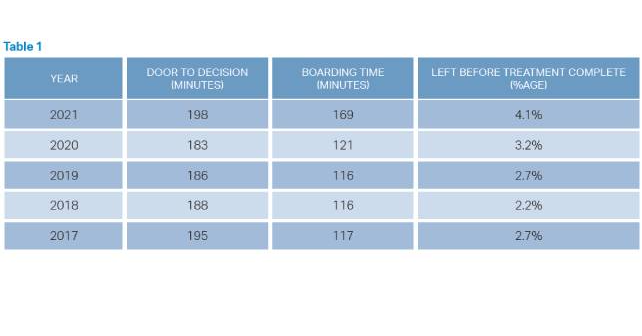
Despite the work of many emergency physicians to preserve flow for all patients, the boarding times in 2021 jumped to 169 minutes, from 121 minutes in 2020. This time interval is very cohort-dependent, ranging from 130 minutes in the smallest volume EDs, to 268 minutes in EDs that see over 80,000 patients. The time from “Door to Decision” actually decreased from 194 minutes in 2020 to 183 minutes in 2021, despite increased use of diagnostic testing due to COVID. Boarding time is more and more a problem of the hospital, not the emergency department.
However, patients who require inpatient boarding are a significant challenge to ED operations. About 68 percent of hospital admissions are processed through the ED, so this “front door” function is very important to the hospital. Continuing to trend higher, about 19 percent of ED visits result in hospital admission.
All ED patient processing times increased significantly in EDs, related to the lengthy ED boarding times. This likely increased ED walkaway rates. The overall length of stay for all ED patients increased to 195 minutes in 2021, up from 182 minutes in 2018, 184 minutes in 2019, and 186 minutes in 2020. The percentage of patients who leave the ED prior to the completion of treatment increased to 4.1 percent, from 2.8 percent in 2020, and 2.7 percent in 2019. The cohort ranges are from about 1.9 percent to 5.1 percent.
Diagnostic testing in the ED evolved with the pandemic changes. There was a 33 percent increased use of CT scans across all groups of EDs. CT scans in 2021 increased to a rate of about 32 procedures per 100 patients versus 24 procedures per 100 patients in 2019.
The Challenges to Emergency Physicians Are Significant
Emergency physicians are seeing higher acuity patients, with more complex medical needs, and an even more important role as the “front door” to the hospital. Most communities are aware of the ED as the portal for critical patients and unexpected events, and with pandemic operations the value of the ED in public health and managing community surges has become even more visible.
Emergency physician leaders must work in earnest with hospital leaders to improve the flow of inpatients in 2023 and beyond. With the lessons and data of 2021 in mind, the need to move admitted patients up to the inpatient units is an obvious management priority.
 Dr. Augustine is national director of prehospital strategy for US Acute Care Solutions in Canton, Ohio; clinical professor of emergency medicine at Wright State University in Dayton, Ohio; and vice president of the Emergency Department Benchmarking Alliance.
Reference
- Yiadom YABM, Napoli A, Granovsky M, et al. Managing and measuring emergency department care: Results of the fourth emergency department benchmarking definitions summit. Acad Emerg Med. 2020;27(7):600–611.
Pages: 1 2 3 | Multi-Page


No Responses to “The Big Recovery: Emergency Department Operations in 2021”