
Emergency physicians and emergency department leaders face an important time in determining how to serve the needs of the communities in a changing health system. The trends that have driven the growth of emergency care have not been altered by government or payer policies to date. The National Hospital Ambulatory Medical Care Survey (NHAMCS) by the US Centers for Disease Control and Prevention (CDC) has detailed a continuous increase in ED visits since at least 1992, as has data from the Emergency Department Benchmarking Alliance (EDBA), and it’s been confirmed in the experiences of most of the 4,800 EDs in the country.
Explore This Issue
ACEP Now: Vol 35 – No 04 – April 2016The 1992 NHAMCS Emergency Department Summary stated that 89.8 million ED visits were made, about 357 visits per 1,000 population. Injuries were the cause of more than 35 percent of the visits. In 2011, visits had grown to 136.1 million, which calculates to 445 visits per 1,000 population.1 Injuries accounted for 29 percent of ED visits, with the highest injury rates in persons age 75 and older. The CDC has not been able to produce visit estimates for 2012 and subsequent years, but it is likely that volumes have increased at a minimum of the 2.4 percent growth rate of the first 19 years of the study. Continuing a 2.4 percent growth rate means that 150 million persons had ED visits in 2015.
More important for predicting ED utilization, staffing, design, and processes are the types of patients visiting the ED. The ED population is aging, which is in line with the demographics of the country. Those persons age 75 and older in 1992 had 558 visits per 1,000 population. In 2011, that number increased to 682 visits per 1,000 population. Similarly, in those persons ages 65 to 74, the utilization increased from 314 to 369. These are the fastest-growing demographics in the country and will continue to grow for the next 20 years.
The EDBA has worked collaboratively with the CDC in producing useful data reports, which are needed for future planning. It hosted three summits that developed the definitions for the industry, the latest being published and used in the annual EDBA survey.2 The 2014 EDBA survey used data from 1,142 EDs that saw 45 million patients. This report now has 11 years of data useful in the ED planning process.
EDBA data show a reduction in the mix of young patients (defined as under age 18), from about 22 percent to about 16 percent over the last 10 years. Ambulance transportation is a stable source of about 16 percent of ED patients, with patients arriving in this manner being admitted around 39 percent of the time. For the sicker or seriously injured patients arriving in the ED, the admission rates over the last 10 years are stable in a range between 16 and 18 percent.
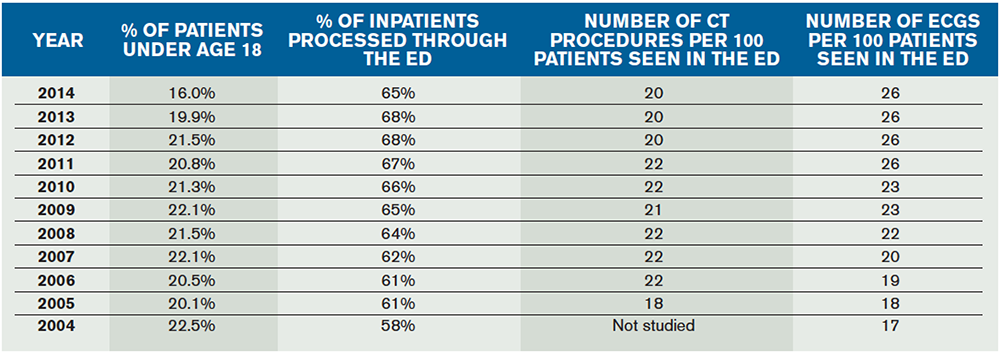
(click here for larger image) Table 1. Critical Trends in 11 years of the EDBA Data Survey
Use of CT scanning appears to have reached a high of 22 procedures per 100 patients, but MRI and other special imaging procedures like ultrasound are used at an increasing rate. The other diagnostic tool that is increasing in ED use is the 12 lead ECG. From 2004 to 2014, ECG utilization increased from 17 uses per 100 patients seen to 26 uses. This trend is likely to continue.
There is a continuing growth in the percentage of overall hospital admissions presenting through the ED. The EDBA data survey over the last five years finds that between 65 and 68 percent of hospital inpatients are processed through the ED. This reflects the role of the ED as the “front door” of the hospital.
There is a tremendous effort by many ED leaders to increase the flow of patients. ED providers have the greatest control over the flow of patients who are evaluated, treated, and released for outpatient follow-up. This represents more than 80 percent of the patients seen in American EDs. Patients managed completely in the ED represent the overwhelming majority of the flow. Despite increasing volumes over the last 11 years and increasing age and acuity of patients, the flow of patients has improved (see Tables 1 and 2). For all patients, the door-to-provider time has decreased from more than 40 minutes to about 28 minutes. (The 2011 NHAMCS study reports this number is 27 minutes.) Overall median length of stay for the complete spectrum of ED patients has decreased about 15 minutes, from about 190 minutes to about 175 minutes. Patients treated and released from the ED have been processed an average of 10 minutes quicker in 2014 than in 2008, from 160 to about 150 minutes. Flow improvements have resulted in an overall reduction in ED patient walkaways, from more than 3 percent to about 2.2 percent.
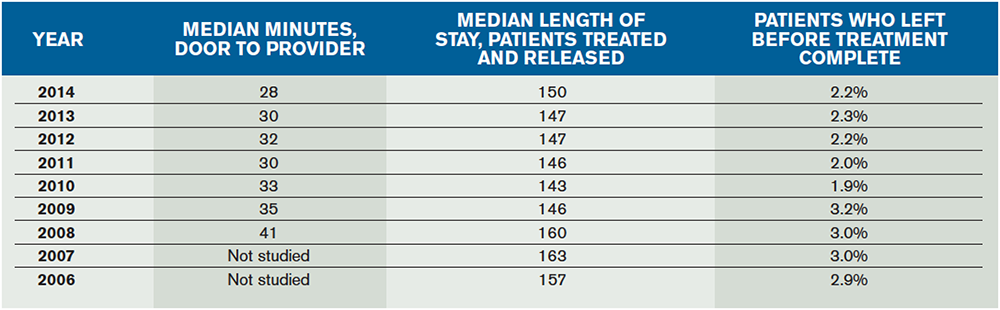
(click here for larger image) Table 2. Trend in ED Median Length of Stay, Time to Provider, and Walkaways
Data from the CDC and from the EDBA indicate that the emergency department is an important and valuable element of the health system, providing unscheduled care to an increasing number of patients over the last 23 years. The ED patient population is increasingly composed of older persons, a proud accomplishment indicating that efforts to reduce premature death from illness and injury are working.
 James J. Augustine, MD, FACEP, is director of clinical operations at EMP in Canton, Ohio; clinical associate professor of Emergency Medicine at Wright State University in Dayton, Ohio; vice president of the Emergency Department Benchmarking Alliance; and on the ACEP Board of Directors.
References
- National Hospital Ambulatory Medical Care Survey: 2011 Emergency Department Summary Tables. CDC Web site. Accessed March 17, 2016.
- Wiler, JL, Welch S, Pines J, et al. Emergency department performance measures updates: proceedings of the 2014 Emergency Department Benchmarking Alliance consensus summit. Acad Emerg Med. 2015;22(5):542-553.
Pages: 1 2 3 | Multi-Page


One Response to “National Surveys on Emergency Department Trends Bring Future Improvements Into Focus”
December 14, 2018
Wendy Hoyhi, thanks for this article! Do you have any idea what percentage of emergency departments are outsourced or where I could find that data?
Thanks so much in advance!